We Want Pictures!
Checking a model geometry can be challenging. To make the process a little easier the ZapMeNot library includes the ability to display an interactive view of the geometry, include source, shields, and detector. The Pyvista package is required to support graphics.
Graphics from a ZapMeNot Python Script
Once you have a model built and populated with a source, detector, and (optionally) shields, the following command can be used to display the model:
# display a model
myModel.display()
Provided you are using a computer and an operating system with a reasonably-modern graphics capability (i.e. not just a console) ZapMeNot will display something similar to the following graphic. In this example the source is a point source shown in red, the detector is shown in yellow, and two shields are shown in blue.
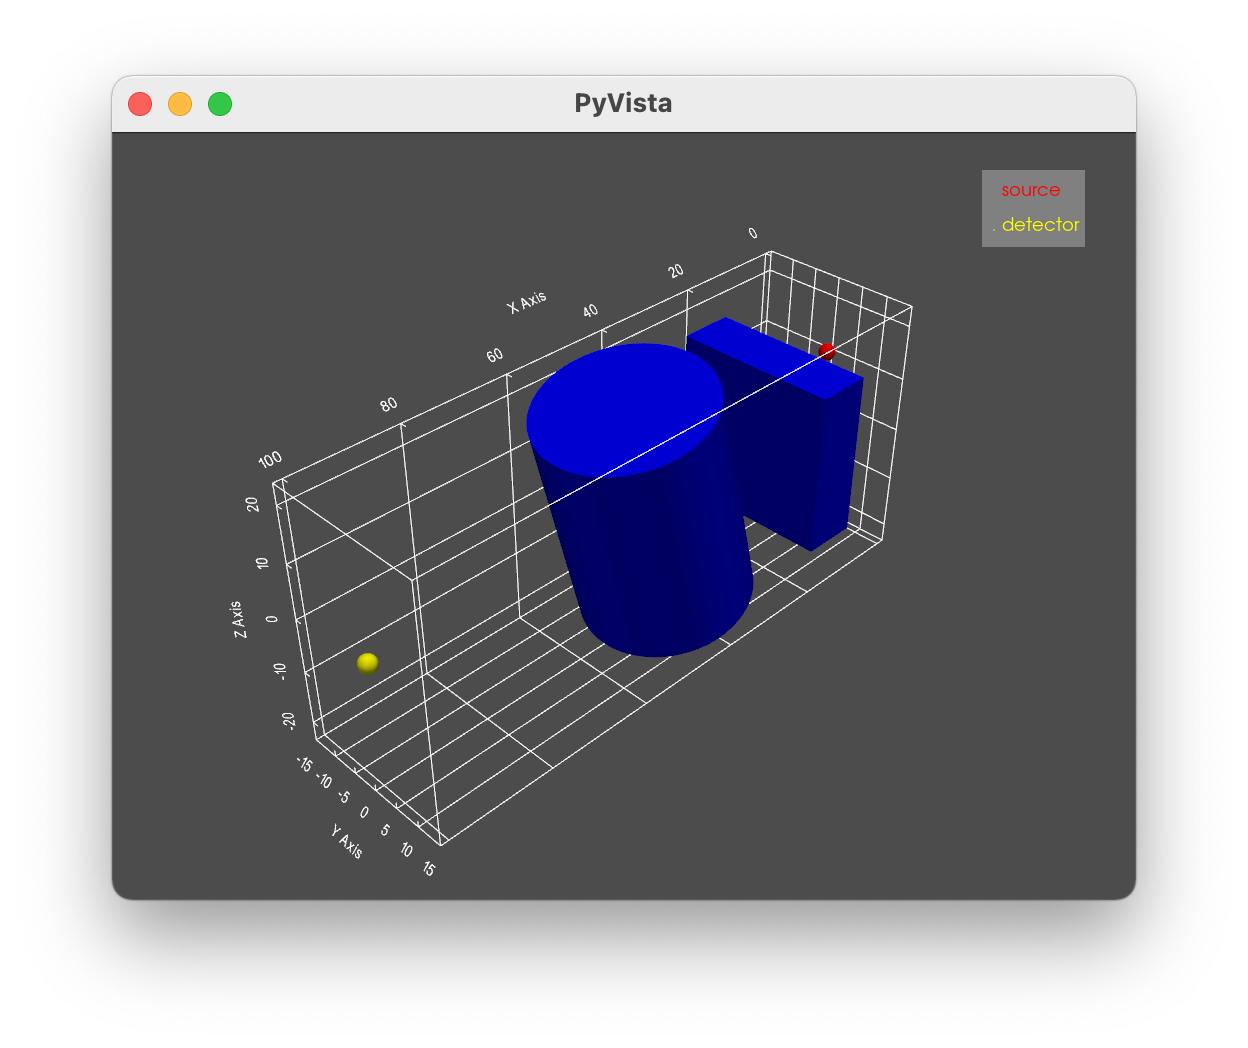
The display can be rotated, moved, zoomed, and more by using a mouse or keyboard shortcuts.
Graphics in a JupyterLab Notebook
A convenient way to document a ZapMeNot analysis is to use a JupyterLab notebook. Embed your python script in a notebook, choose the appropriate python environment, and everything runs just as if you were executing a python script from the command line.
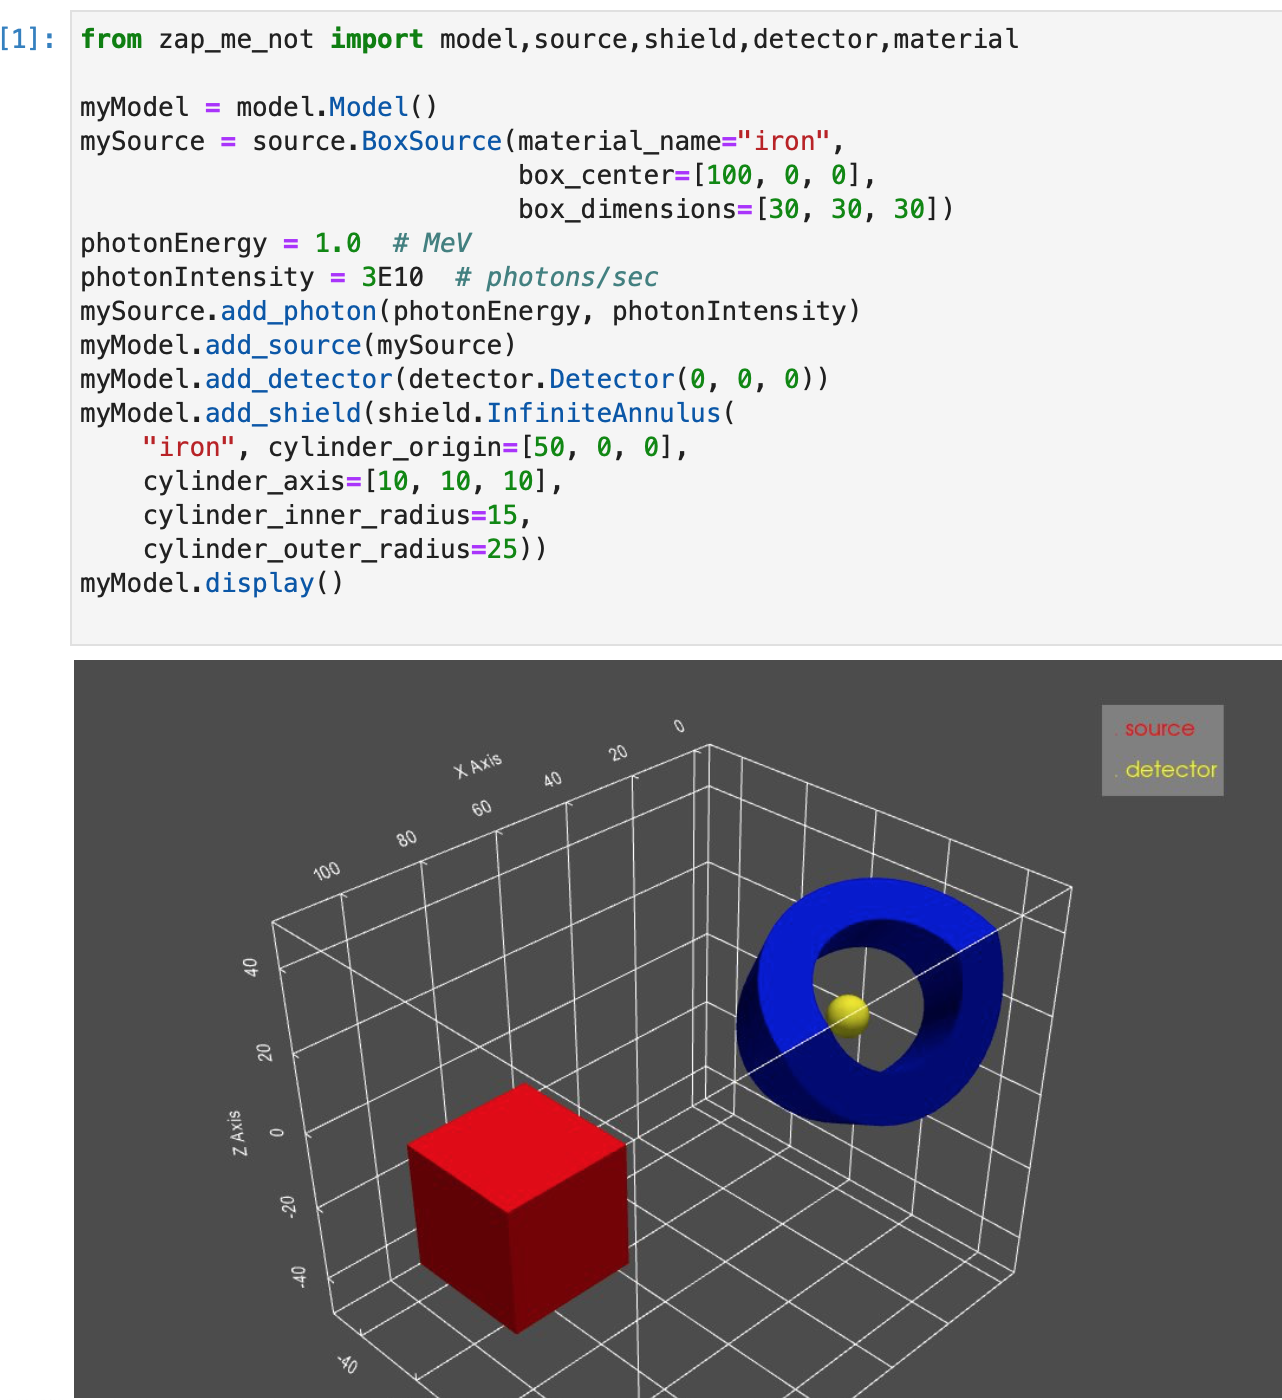
Here’s a screenshot of a JupyterLab notebook. Your display may look different, depending on your workstation configuration.
An interesting factoid is that you can work with a JupyterLab notebook in a JupyterLab server (the usual way) but also in the Visual Studio Code editor! Visual Studio Code (aka VSCode) will display a notebook page, let you choose an appropriate python environment, run the analysis, and finally display the graphics. The only prerequisite is the installation of the Jupyter extension pack for VSCode (https://marketplace.visualstudio.com/items?itemName=ms-toolsai.jupyter).
Going Headless For Fun and Profit
It is possible to display the model on a headless linux server (one with no graphics card) or on a server that just has a really terrible graphics chip. Two approaches have been used: a Jupyterlab notebook in VSCode and a Jupyterlab server displayed on a local computer display.
It’s a bird, it’s a plane, it’s VSCode!
It’s not uncommon to use XWindows to display locally a session running on a remote headless server. VSCode can be used to display a Jupyterlab notebook in a manner similar to that described in the previous section, but with one simple change. You need to add the following line to your python script:
import pyvista
pyvista.set_jupyter_backend('client')
This line tells Jupyterlab (and pyVista) to display graphics using the graphics capability of the “client” (the local computer). That’s all it takes!
Going Full Jupyter
For those who dislike VSCode, a headless server can be used to display a Jupyterlab session in your desktop brower. Start a Jupyterlab session on the server and connect with your desktop brower in the usual fashion. Modify your ZapMeNot python script to start with the following lines:
import os
import pyvista
pyvista.set_jupyter_backend('client')
pyvista.global_theme.trame.server_proxy_enabled = True
os.environ['TRAME_DEFAULT_HOST'] = 'YOUR_SERVER_NAME_HERE'
pyvista.global_theme.trame.server_proxy_prefix = ' http://YOUR_SERVER_NAME_HERE:'
This tells Jupyterlab to use the local client for graphics and also tells the local browser the path back to the server for additional graphics details.